Optimizing Transformer Model Serving Parameters – An Apple Silicon GPU Case Study
July 11, 2026
One MacBook Pro M4 Max, an open-source MoE, and a hands-on exercise in optimizing it for inference: why the thing that collapses LLM throughput by 100× is prefill, not decode, and the two prefill-side fixes that got it back.
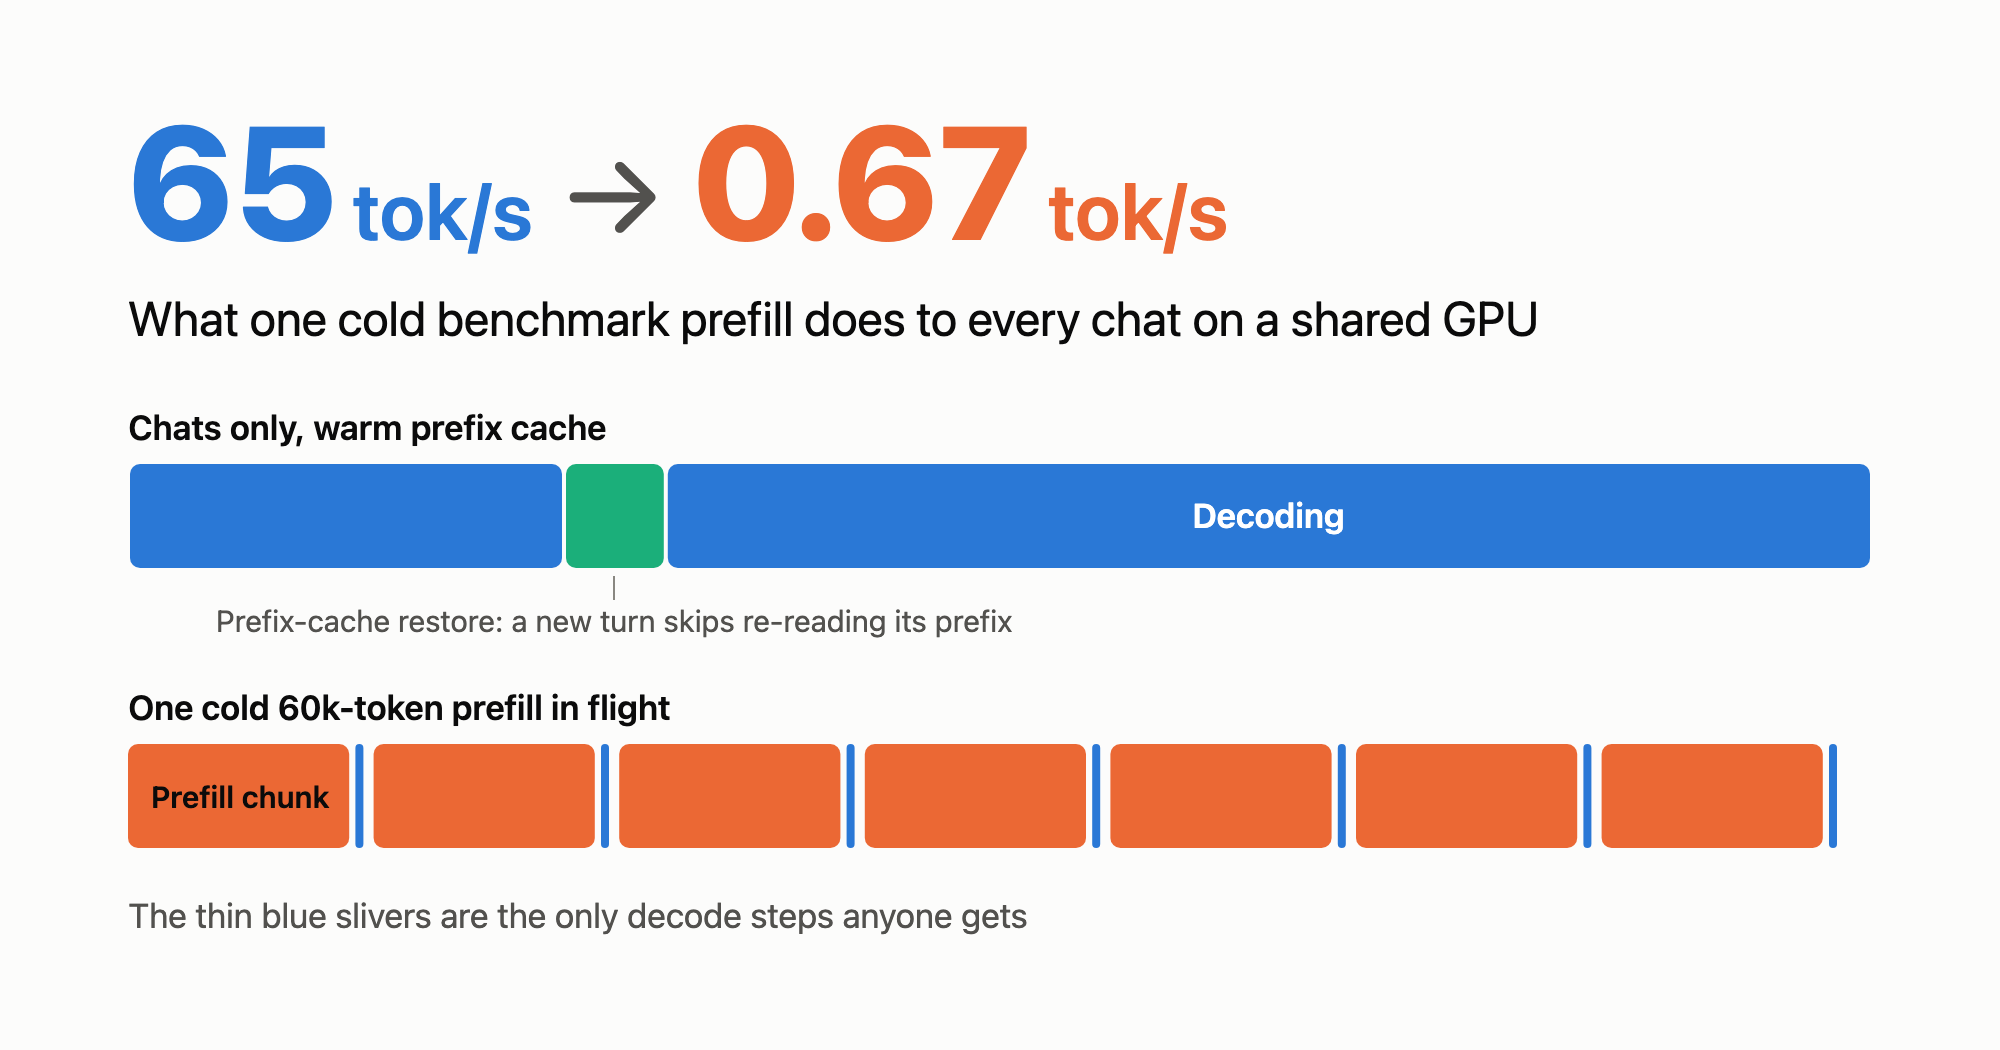
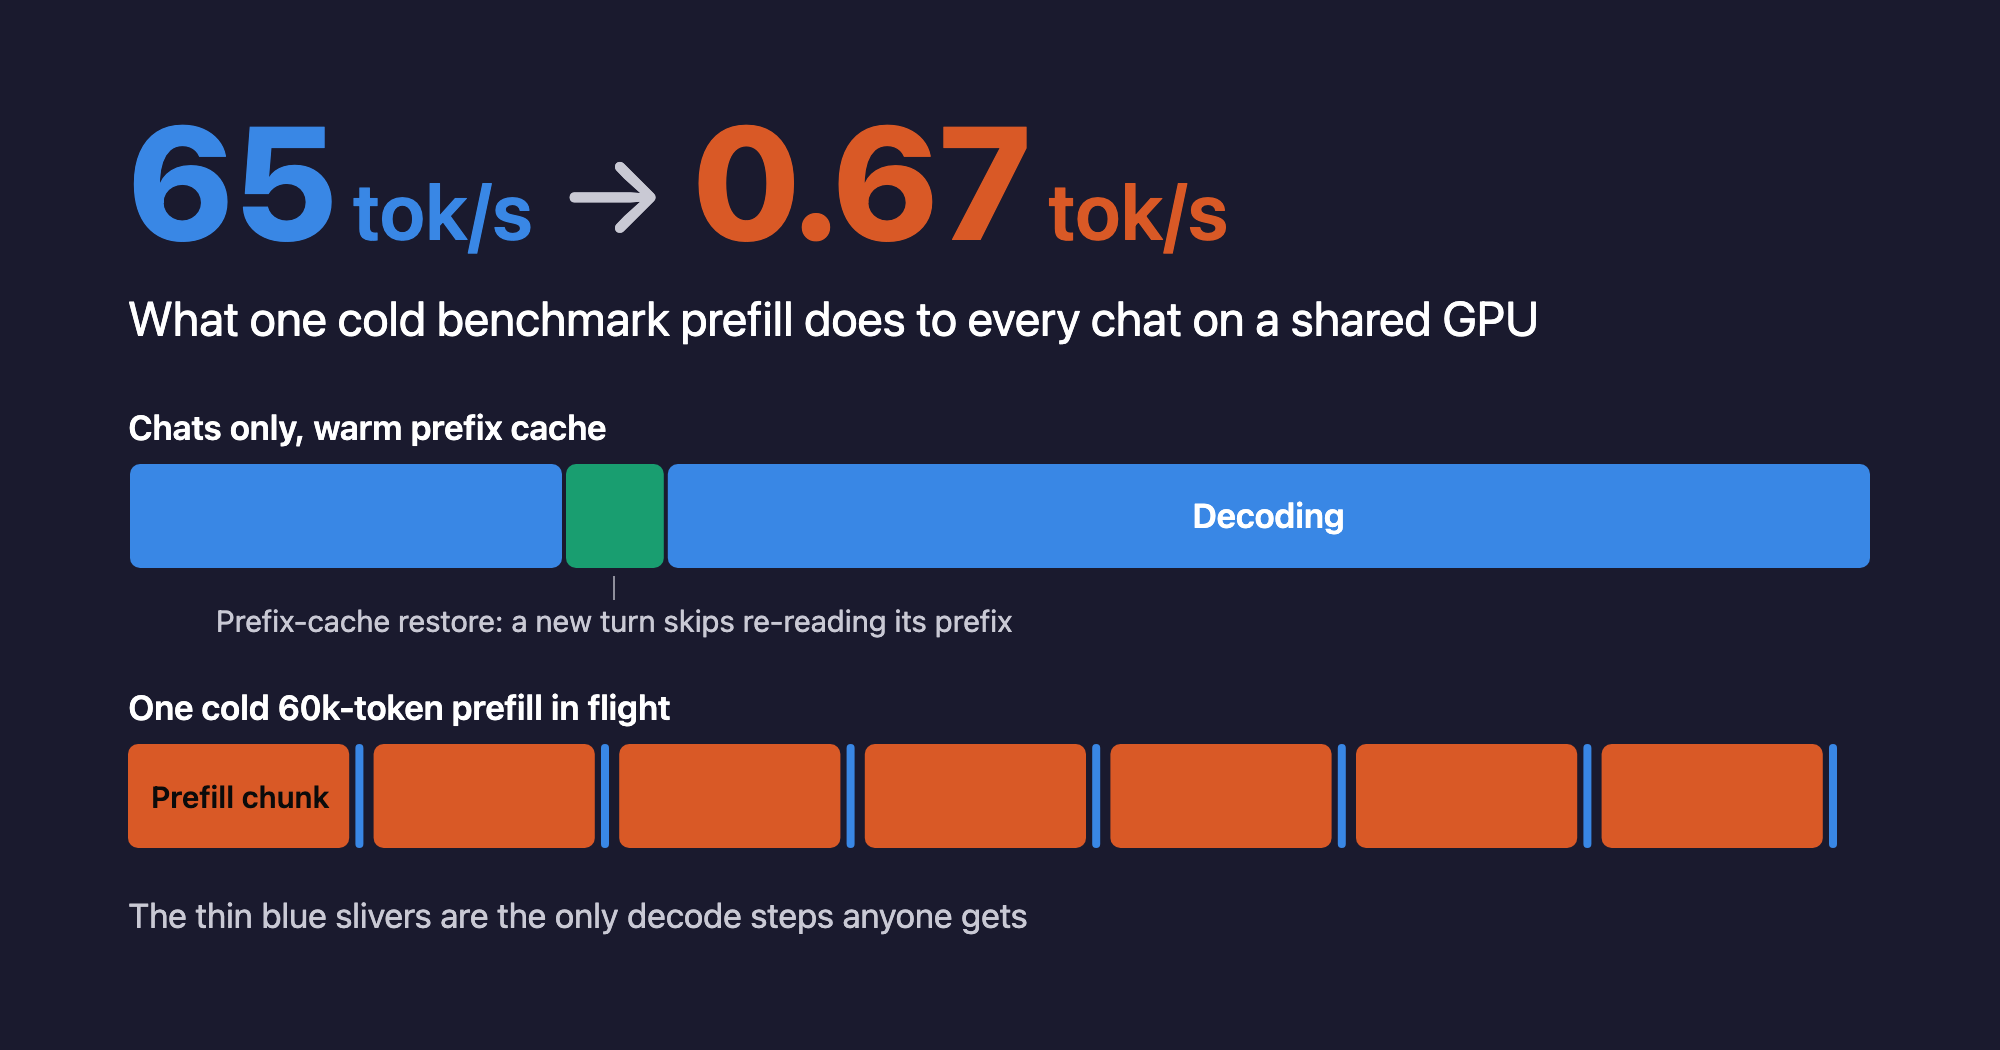
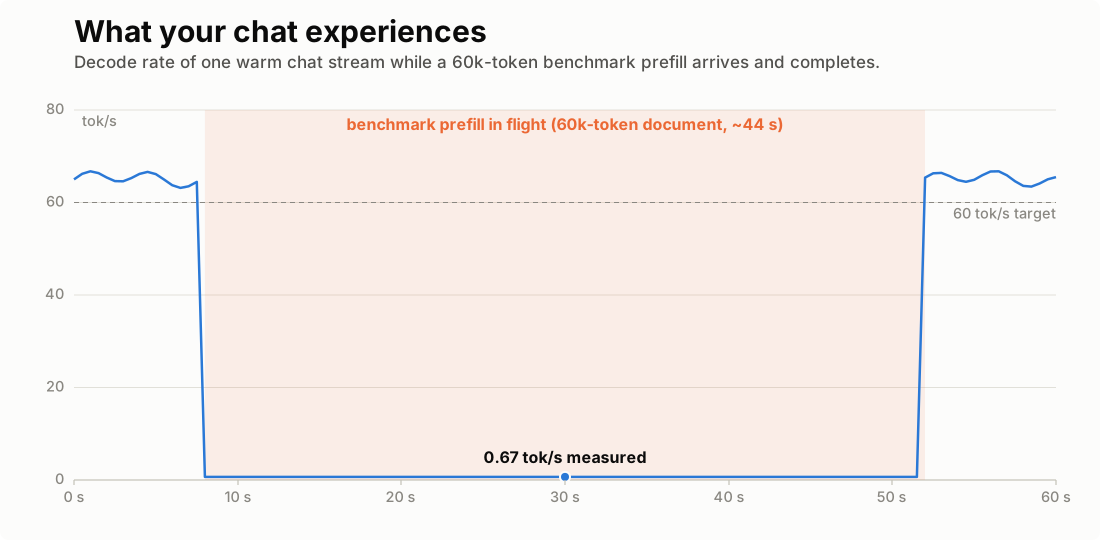
A GPU occupancy timeline showing chat decode collapsing from 65 to 0.67 tokens per second while benchmark prefill chunks occupy the GPU.
I have a MacBook Pro M4 Max, and it’s my portable LLM/VLM lab.
It started innocently, just running various open-source models on it for the vibes, seeing what they could do. But over time it got serious: I began hosting LLMs and VLMs locally to drive a coding agent, and running massive benchmarks alongside them (hundreds of questions, each a 10–25k+ token prompt, several workers firing at once). One evening my chats suddenly slowed to a crawl, tokens oozing out like tar, slow enough to read along with. The instrumented number was worse than it felt: 0.67 tokens per second, on a box that decodes at 65 tok/s with nothing else running.
A 100× collapse with no crash, no error, and a GPU that was demonstrably busy the whole time. This post is the diagnosis and the fix. The physics is textbook (prefill is compute-bound, decode is bandwidth-bound), but almost everything written about the consequences assumes a datacenter where you can throw more GPUs at the problem. This is the other story: one Metal box, two workloads, and me, determined to make the most of it.
The setup
The model is a 35B-parameter mixture-of-experts with roughly 3B active parameters, quantized to mxfp8 (about 3 GB of weights touched per output token), served with a batched MLX engine (mlx-vlm) behind an OpenAI-compatible endpoint. The M4 Max has 128 GB of unified memory at 546 GB/s.
Two very different tenants share it:
- Agent chats. Multi-turn, tool-calling sessions. Each turn re-sends the conversation so far, so a session grows one long warm prefix; mine hover around 23k tokens. Here I’m parked in front of the screen watching tokens stream out in real time, so if the latency drags, the whole experience falls apart.
- Benchmarks. A run is ~150 questions, each a fresh 10–25k+ token prompt (long documents, retrieval context), issued by several concurrent workers. In a leaderboard-grinding run like this, nobody has to wait around; just ping me when the scores land.
The chats are just my concrete case: they stand in for any interactive stream (an agent loop, a coding assistant, anything with a human waiting on the other end), the way the benchmarks stand in for any batch workload.
Averaged across a day, the box reads 77 input tokens for every output token it writes, a 77:1 input:output ratio. The GPU’s job here is overwhelmingly prompt-reading, not token-writing. Keep that ratio in mind; it comes back later.
Two jobs, two bottlenecks
A transformer serves a request in two phases, and they stress opposite parts of the machine.
Decode scales with memory bandwidth. Each decode step reads the model’s active weights from memory once and emits one token per in-flight sequence. The arithmetic is one division:
ceiling:  546 GB/s ÷ ~3 GB per step ≈ 180 tok/s
measured: 60–70 tok/s (about a third of the naive bound)
That naive division leaves out a lot:
- KV-cache reads. This is a hybrid model: only about a quarter of its layers use full attention (the rest are linear), so only those layers keep a growing key/value cache, ~20 KB per token overall, that they re-read in full on every step. A chat sitting at 23k tokens therefore adds roughly half a gigabyte to every step’s reads (23k tokens × 20 KB), a sixth of the weights again. kipply calls this the “sometimes-significant factor”; DeepMind’s scaling book puts it straight into the floor: minimum step time = (batch × KV cache + parameters) ÷ bandwidth.
- Kernels run below peak bandwidth. kipply budgets real kernels at 72–90% of theoretical; even hand-tuned FasterTransformer decoding a 13B model on an A100 measured 22 ms per token (~45 tok/s) where her arithmetic predicted 18.5 ms (~54 tok/s).
- Everything between the matmuls. Softmax, layernorm, residuals: small memory-bound passes the weights-only division doesn’t count.
- This stack’s own taxes. mlx-vlm’s per-step overhead, and a MoE gathering its experts from scattered memory instead of one contiguous read.
So a third of the naive bound is an unremarkable place to land. That 65 tok/s is about 36% of an idealised useful-byte roofline; whether the rest goes to a bandwidth wall or to kernel, routing, and launch inefficiency I cannot say, because I did not capture achieved-bandwidth counters. The rate clearly scales with bandwidth; that it is pinned at the roofline is a hypothesis I have not demonstrated.
The ceiling is set by bandwidth, not capacity: my whole memory footprint (weights + KV caches + prefix cache) peaks around 40–50 GB of the 128 GB. Buying more memory would change nothing for a single stream’s speed. So how do you serve several at once? Not with more memory, but by sharing the step: at batch N the attention and shared-expert weights are read once for all N sequences. It’s a mixture-of-experts, so the routed experts a batch touches are the union of its tokens’ choices rather than one fixed set, which makes decode batching cheap but not free. Cheap enough, though, that decode sharing was never the multi-tenant problem. But the real cost of that traffic is never decode-only, and that is exactly what the rest of this post is about.
Prefill is compute-bound. Before a request can decode its first token, its entire prompt must be pushed through the model. That’s large matrix multiplies across the full sequence (all 40 GPU cores saturated), processed in 2,048-token chunks that each take one to two seconds at document scale. And here is the part that matters for multi-tenancy: while a prefill chunk runs, nobody decodes.
The core problem: interleaved compute
The engine interleaves the two phases by granting roughly one decode step between prefill chunks. When the GPU is mostly decoding (the agent-chat case), you never notice. But the moment a benchmark-class task moves in, the GPU is never mostly decoding:
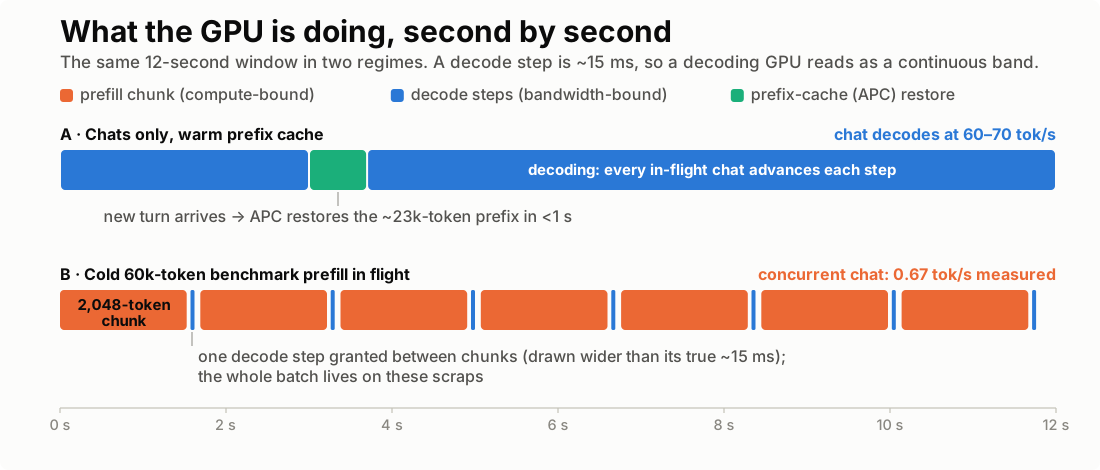
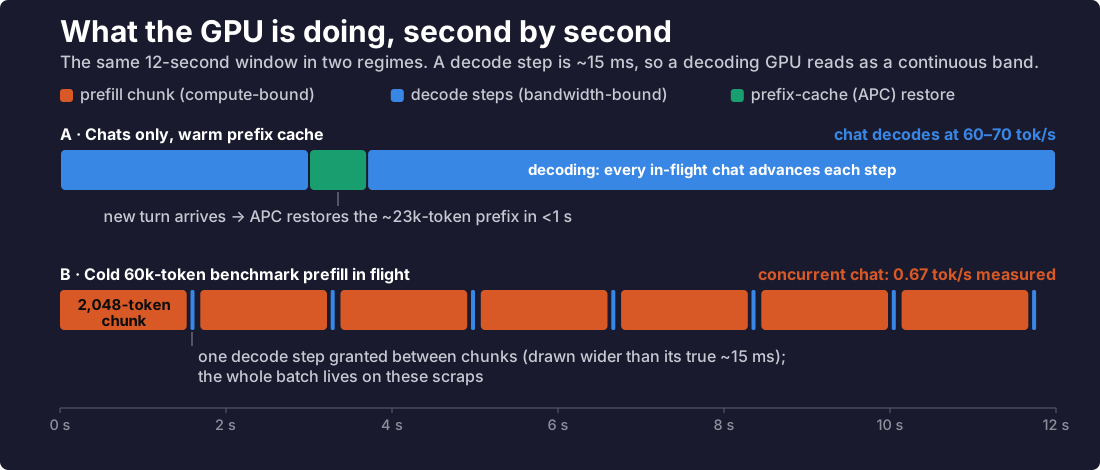
A benchmark task is essentially continuous prefill. Every question is new content, so it never hits the prefix cache: guaranteed cache miss, full prefill, N times per run, usually with several workers firing concurrently to keep the queue full. At any given moment some 2,048-token chunk is almost always occupying the GPU, and every decoder in the batch lives on the one-step scraps between chunks. In this case I measured it directly: during a single 60k-token prefill, a concurrent chat stream decoded at 0.67 tok/s. Here is roughly how it felt:
The model-serving literature has a name for this, generation stalls, and the numbers there match this case: prefill-prioritizing schedulers can pause ongoing decodes for seconds at a time. The Sarathi-Serve paper (OSDI ‘24) diagnosed exactly this in vLLM and introduced stall-free batching: cap the prefill budget per iteration and coalesce a prefill chunk with the ongoing decodes rather than in place of them. Chunked prefill with decode-aware scheduling has since become the default in vLLM’s V1 engine, and SGLang ships the same technique.
The resident KV-cache overhead
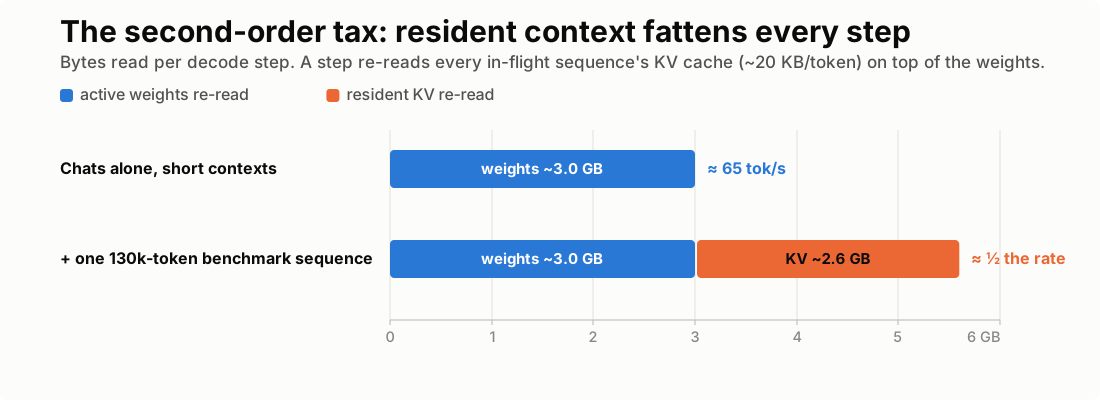
There’s a subtler effect worth separating out. Each decode step re-reads not just the weights but every in-flight sequence’s KV cache, at the ~20 KB per token noted above. Chat-scale contexts are the mild case. A benchmark sequence sitting at 130k tokens adds ~2.6 GB of reads (130k tokens × 20 KB) to every step, for everyone:
The obvious optimization is KV-cache quantization: fewer KV bytes per step, less overhead. But on my pinned mlx-vlm and its concurrent multi-row hybrid path, quantized KV and APC (automatic prefix cache) do not yet fully compose, so enabling one meant giving up the other. For the chat tenant that settles it: its multi-turn sessions re-hit the same ~23k-token prefix every turn, so avoiding that prefill beats cheaper KV reads during decode, and I kept the prefix cache. mlx-vlm will soon support running both together, see #1559. If your input:output ratio runs the other way, decode-heavy, then quantizing the KV cache is exactly the optimization to reach for.
The two key optimizations
So every optimization that worked happened on the prefill side. That’s the conclusion of this whole case study: protect decode by controlling when and where prefill happens, because decode sharing was never the problem.
1. A bigger prefix cache. Chats amortize their prefill only if the cache holds their prefix. I raised the prefix-cache capacity so ~6 concurrent sessions stay warm; turn N+1 now restores its ~23k-token prefix in under a second instead of re-prefilling it for tens of seconds. A restored prefix still occupies runtime KV while the request decodes, so a bigger cache costs resident memory, not less; what it buys is avoided prefill and lower TTFT. This is the real advantage of a large unified-memory pool on Apple Silicon: not faster decode (see the bandwidth division above), but a bigger cache that avoids prefill.
2. An admission gate for document-scale prefills. At most one big prefill is admitted at a time, and the scheduler holds the decode gaps between its chunks instead of letting queued prefills claim them back-to-back. Interactive streams keep receiving steps no matter how deep the prefill queue gets, which is close in spirit to the policy-level idea behind Sarathi’s stall-free batching.
With both optimizations in place, chats stream at 60–70 tok/s in the windows between prefill chunks instead of crawling, so the interactive feel comes back, even though the GPU still spends most of a benchmark run prefilling. The GPU never got faster; it just stopped being asked to do the wrong thing at the wrong time. Inspired by how DistServe and Splitwise split prefill and decode across separate hardware, in the long run the right answer is to put workloads of different character on their own dedicated compute (budget permitting 🤑).
Trade-off: TTFT vs. ITL
The two sides of the prefill/decode latency tug-of-war each have a name in model serving. TTFT (time to first token) is how long a request waits before its first token appears: queueing plus the prefill compute of pushing the whole prompt through the model, the matmuls and attention that grow with prompt length. ITL (inter-token latency; also written TPOT, time per output token, or TBT, time between tokens, in the Sarathi paper) is the gap between tokens once a stream is decoding: the decode-step cadence.
Re-read the incident through these two concepts: the benchmark tenant’s TTFT work stretched the interactive-chat tenant’s ITL from ~15 ms to ~1.5 s (nearly a 100× regression), and it was hidden by the aggregate throughput and GPU-utilization metrics. The two earlier optimizations map onto these two concepts too: the bigger prefix cache is a TTFT fix (a warm turn now starts in under a second), and the admission gate is an ITL fix (it bounds a chat’s worst token gap at roughly one chunk time, no matter how deep the prefill queue gets).
The reason these two metrics matter is that they trade against each other on a shared GPU, and the main lever between them is how much prefill you admit between decode steps, i.e. the chunk size (the decode quota, arrival rate, and cache state matter too). Bigger chunks finish the prompt sooner (better TTFT) but stretch every concurrent stream’s token gap (worse ITL). Chop the chunks finer and concurrent interactive streams breathe again (better ITL), at the cost of a fixed overhead per extra chunk boundary (kernel launches, re-touching the prefix KV) that makes the big prompt itself take longer (worse TTFT); at the extreme, decode-first scheduling starves prefill entirely.
A concrete example: the TTFT curve below is one long-document prompt’s own TTFT. Its first token cannot appear until all 60,000 of its prompt tokens are prefilled, so no chunk size takes it below the ~44 s prefill floor; chunk size only decides how much overhead it pays on top of that floor, and how long the other streams wait meanwhile. Neither extreme of chunk size is usually what we want; the point is to find the sweet spot for your use case:
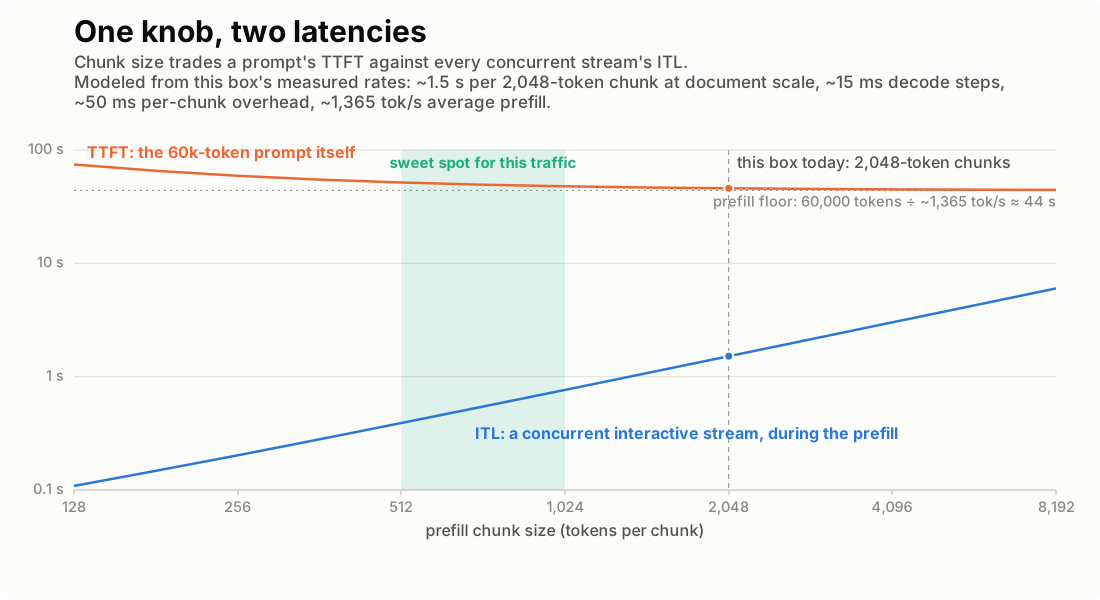
For this case, the comfortable sweet spot sits around 512–1,024 tokens per chunk: concurrent chats keep their token gaps at roughly 0.4–0.8 s while a 60k-token prompt pays a 15–30% TTFT premium over its ~44 s floor. My current 2,048-token setting sits to the right of that band: a deliberate lean toward benchmark completion times, whose cost is a worst-case 1.5-second (0.67 tok/s) gap in the interactive chat’s decode. This is exactly the point of the admission gate: it keeps a decode window open between prefill chunks, so the chat streams at a full 60–70 tok/s during it. What the chat feels, then, is normal-speed streaming punctuated by periodic brief stalls, not the 0.67 tok/s crawl from the opening.
A broader look: the market’s compute ceiling
Everything above was bounded by one number: 546 GB/s. Since the whole post argues that single-stream decode is just a bandwidth division, running that same division across hardware actually built for inference shows two things at once: how much bandwidth datacenter money really buys, and where this laptop falls on the full spectrum.
| Hardware | Memory | Bandwidth | vs. M4 Max | Indicative decode, this model* |
|---|---|---|---|---|
| Apple M4 (MacBook Pro) | ≤ 32 GB unified | 120 GB/s | 0.2× | ~14 tok/s |
| Apple M5 | ≤ 32 GB unified | 153 GB/s | 0.3× | ~18 tok/s |
| Apple M4 Max (this post) | 128 GB unified | 546 GB/s | 1× | 65 tok/s (measured) |
| Apple M5 Max, 40-core GPU (Mar 2026) | 128 GB unified | 614 GB/s | 1.1× | ~73 tok/s |
| Apple M3 Ultra (Mac Studio, current top) | ≤ 512 GB unified | 819 GB/s | 1.5× | ~98 tok/s |
| Apple M5 Ultra (Mac Studio, rumored late 2026) | ≤ 768 GB unified, rumored | ~1.2 TB/s† | ~2.2× | ~145 tok/s |
| NVIDIA GeForce RTX 3090 | 24 GB GDDR6X | 936 GB/s | 1.7× | ~110 tok/s |
| NVIDIA GeForce RTX 4090 | 24 GB GDDR6X | 1.0 TB/s | 1.8× | ~120 tok/s |
| NVIDIA GeForce RTX 5090 | 32 GB GDDR7 | 1.8 TB/s | 3.3× | ~215 tok/s |
| NVIDIA A100 (SXM, 80 GB) | 80 GB HBM2e | 2.0 TB/s | 3.7× | ~240 tok/s |
| NVIDIA H100 (SXM) | 80 GB HBM3 | 3.35 TB/s | 6.1× | ~400 tok/s |
| NVIDIA H200 | 141 GB HBM3e | 4.8 TB/s | 8.8× | ~570 tok/s |
| NVIDIA B100 / B200 (Blackwell) | 192 GB HBM3e | 8 TB/s | ~15× | ~950 tok/s |
| NVIDIA B300 (Blackwell Ultra) | 288 GB HBM3e | 8 TB/s | ~15× | ~950 tok/s |
| NVIDIA Rubin (late 2026, HBM4) | 288 GB HBM4 | 13 TB/s | ~24× | ~1,500 tok/s |
| Groq LPU | 230 MB SRAM per chip | 80 TB/s on-die | ~146× | ~9,500 tok/s on paper (see below) |
| SSD offload tier (e.g. Phison aiDAPTIV+) | TB-scale NAND | ~7–14 GB/s | ~0.01–0.03× | ~1–2 tok/s (see below) |
* Naive scaling of my measured 65 tok/s by the bandwidth ratio: same ~3 GB-per-step MoE, batch one, software efficiency held constant. Real numbers move with the serving stack and batch depth, and the smaller-memory rows (24–32 GB) could not actually hold this ~40–50 GB deployment; read the column as counterfactual bandwidth-only headroom, not a benchmark.
† Unannounced. Apple skipped an M4 Ultra, so the current Mac Studio tops out at the M3 Ultra; the M5 Ultra figure assumes UltraFusion doubles the M5 Max’s 614 GB/s, the pattern every previous Ultra has followed. If it ships that way, the top Mac would sit at roughly 60% of an A100’s bandwidth.
Four things fall out of the table.
Decode speed is proportional to bandwidth. The public state-of-the-art numbers track it too. Groq serves Llama 4 Scout at 460+ tok/s per user, and NVIDIA’s 1,000 tok/s-per-user record on Llama 4 Maverick runs on a DGX B200 (8 TB/s per GPU) with EAGLE-3 speculative decoding on top, which is itself a bandwidth play: draft tokens cheaply so each expensive full-weight read verifies several tokens instead of one. When a vendor advertises astonishing tokens per second, the first question isn’t “what scheduler”; it’s “what memory system, and how many bytes per token.” And this lever isn’t datacenter-only: mlx-vlm supports speculative decoding too (EAGLE-3 included).
Groq pushes the capacity-versus-bandwidth trade to its limit. The 80 TB/s comes from keeping weights in on-chip SRAM, but at ~230 MB per chip, a model spans hundreds of chips in a deterministic pipeline. That’s that trade inverted: nearly no memory per chip, absurd bandwidth to what’s there, disaggregation as the founding assumption rather than an optimization. It’s also why the row’s ~9,500 tok/s is on-paper only: no model fits on one chip, and once the weights are pipelined across hundreds of them, per-chip SRAM bandwidth stops being the number you divide by; interconnect hops and pipeline depth set the pace, and measured GroqCloud speeds on models this size land in the hundreds of tokens per second, not thousands. A unified-memory Mac is the opposite pole of the same design space: one flat 128 GB pool, one chip, and every byte equally slow at 546 GB/s.
SSD offload is the same division with a tiny numerator, and only decode pays it in full. Offload tiers like Phison’s aiDAPTIV+ extend GPU memory with NAND: TB-scale capacity, but a fast NVMe drive reads at ~7–15 GB/s (PCIe Gen4 to Gen5), and even a small stripe only reaches a few tens of GB/s. Put per-step bytes there and the division is merciless: 14 GB/s ÷ ~3 GB per step is a ~5 tok/s ceiling before any software efficiency, slower than a base M4. And prefill is no refuge for this model: a 2,048-token chunk routes its tokens through nearly every expert in each MoE layer, so it touches most of the model’s tens of gigabytes, not the ~3 GB active for one token. Streaming that from an SSD takes seconds, comparable to or longer than the ~1.5 s the chunk spends computing, so the offload tier bottlenecks prefill too. The rule that falls out: SSDs belong under bytes read once per turn, never bytes read once per step. A prefix cache spilled to SSD is the good case (restoring a 23k-token prefix, ~460 MB of KV, costs well under 100 ms against the tens of seconds of prefill it avoids); weights you touch every token stay in fast memory. That split is also why these tiers are pitched at fine-tuning and batch work rather than interactive serving.
The laptop’s real deficit isn’t bandwidth; it’s prefill compute. Per watt, 546 GB/s in a laptop that draws around a hundred watts at the wall is the same order of bandwidth-per-watt as an H100’s 3.35 TB/s at 700 W for the module alone. What the datacenter parts actually run away with is matmul throughput: an H100’s tensor cores deliver on the order of 15–30× the M4 Max’s usable matmul rate, against only a ~6× bandwidth edge. That asymmetry is exactly why my failure mode was prefill and not decode, and why Apple pointing the M5 generation’s per-GPU-core Neural Accelerators at AI compute (Apple claims ~4× peak GPU AI compute versus M4) moves the needle where this workload actually hurts. Meanwhile the Mac’s superpower stays what it was: capacity per dollar. The GeForce rows make the same point from the other side: the community’s favorite local-hosting cards double or triple the M4 Max’s bandwidth, but a 24 GB RTX 4090 holds less than a fifth of its 128 GB, so the models it can even load are a different class. And as the fixes above showed, capacity buys cache, and cache avoids prefill.
Takeaways
- Decode speed is a bandwidth division, not a capacity function. 546 GB/s ÷ bytes-per-step sets the ceiling. On Apple Silicon the upgrade that moves it is an Ultra-class chip (~819 GB/s of bandwidth, roughly +50%), not more RAM.
- Memory bandwidth sets the roofline for low-batch decode, but it is not the whole story. From an SSD tier’s ~10 GB/s through a MacBook’s 546 GB/s of LPDDR and Blackwell’s 8 TB/s of HBM3e to Groq’s 80 TB/s of SRAM, single-stream decode scales with the memory system (though not linearly across such different hardware); realized tok/s also depends on bytes per accepted token, kernels, speculation, and interconnect. Scheduling cleverness moves you toward the ceiling; hardware moves the ceiling.
- Prefill is where multi-tenant damage comes from. Decode sharing was never the villain; a single document-scale prefill squeezes every decoder to ~1 tok/s.
- TTFT and ITL trade against each other, and chunk size is the main lever. If chunks are bigger, they favor prompt completion; if smaller, they favor streaming smoothness. Draw the two curves for your own box and pick the sweet spot on purpose instead of inheriting a default.
- Memory capacity buys cache, and cache lets you skip prefill. That’s the whole value chain. Size the prefix cache to your concurrent sessions before touching anything else.
- Match the optimization to your use case. Whether to quantize the KV cache comes down to how much your prefixes repeat: high reuse (multi-turn chats hitting the same prefix) favors the prefix cache; low reuse with long live contexts favors quantizing KV.
- You can emulate the datacenter answers with policy. Chunked prefill + admission control approximates stall-free batching; routing batch workloads to other hardware approximates P/D disaggregation.